I've started thinking that there's a useful distinction to be made in two different ways of doing historical textual analysis. First stab, I'd call them:
Assisted Reading: Using a computer as a means of targeting and enhancing traditional textual reading—finding texts relevant to a topic, doing low level things like counting mentions, etc.
Text Mining: Treating texts as data sources to chopped up entirely and recast into new forms like charts of word use or graphics of information exchange that, themselves, require a sort of historical reading.
Humanists are far more comfortable with the first than the second. (That's partly why they keep calling the second type of work 'text mining', even I think the field has moved on from that label--it sounds sinister). Basic search, which everyoneuses on J-stor or Google Books, is far more algorithmically sophisticated than a text-mining star like Ngrams. But since it promises to merely enable reading, it has casually slipped into research practices without much thought.
The distinction is important because the way we use texts is tied to humanists' reactions to new work in digital humanities. Ted Underwood started an interesting blog to look at ngrams results from an English lit perspective: he makes a good point in his first post:
I finally got some call numbers. Not for everything, but for a better portion than I thought I would: about 7,600 records, or c. 30% of my books.
The HathiTrust Bibliographic API is great. What a resource. There are a few odd tricks I had to put in to account for their integrating various catalogs together (Michigan call numbers are filed under MARC 050 (Library of Congress catalog), while California ones are filed under MARC 090 (local catalog), for instance, although they both seem to be basically an LCC scheme). But the openness is fantastic--you just plug in OCLC or LCCN identifiers into a url string to get an xml record. It's possible to get a lot of OCLCs, in particular, by scraping Internet Archive pages. I haven't yet found a good way to go the opposite direction, though: from a large number of specially chosen Hathi catalogue items to IA books.
This lets me get a slightly better grasp on what I have. First, a list of how many books I have for each headline LC letter:
Before Christmas, I spelled out a few ways of thinking about historical texts as related to other texts based on their use of different words, and did a couple examples using months and some abstract nouns. Two of the problems I've had with getting useful data out of this approach are:
What words to use? I have 200,000, and processing those would take at least 10 times more RAM than I have (2GB, for the record).
What books to use? I can—and will—apply them across the whole corpus, but I think it's more useful to use the data to draw distinctions between types of books we know to be interesting.
I've got tentative solutions to both those questions. For (2), I finally figured out how to get a substantial number of LCC call numbers into my database (for about 30% of the books). More on that later, which I'm obviously excited about. But I finally did some reading to get a better answer for (1), too. This is all still notes and groundwork-laying, so if you're reading for historical analysis or DH commentary, this is the second of several skippable posts. But I like this stuff because it gives us glimpses at the connections between semantics, genre, and word-use patterns.
Basically, I'm going to start off using tf-idf weight. A while ago, I talked about finding "lumpy" words. Any word appears in x books, and y times overall. We can plot that. (I'm using the data from the ngrams 1-set here instead of mine, because it has a more complete set of words. There are lots of uses for that data, for sure, although I keep finding funny little mistakes in it that aren't really worth blogging—they seem to have messed up their processing of contractions, for instance, and their handling of capital letters forces some guess-work into the analysis I'm doing here). Each blue dot in this graph is a word: the red ones are the 1000 or so ones that appear a lot but in fewer books than you'd think. Those words should be more interesting for analysis.
Dan Cohen gives the comprehensive Digital Humanities treatment on Ngrams, and he mostly gets it right. There's just one technical point I want to push back on. He says the best research opportunities are in the multi-grams. For the post-copyright era, this is true, since they are the only data anyone has on those books. But for pre-copyright stuff, there's no reason to use the ngrams data rather than just downloading the original books, because:
Ngrams are not complete; and
Were they complete, they wouldn't offer significant computing benefits over reading the whole corpus.
Edit: let me intervene after the fact and change this from a rhetorical to a real question. Am I missing some really important research applications of the 5-grams in what follows? Another way of putting it: has the dump that Google did for the non historical ngrams in 2006 been useful in serious research? I don't know, but I suspect it might have been.
Back to my own stuff. Before the Ngrams stuff came up, I was working on ways of finding books that share similar vocabularies. I said at the end of my second ngrams post that we have hundreds of thousands of dimensions for each book: let me explain what I mean. My regular readers were unconvinced, I think, by my first foray here into principal components, but I'm going to try again. This post is largely a test of whether I can explain principal components analysis to people who don't know about it so: correct me if you already understand PCA, and let me know me know what's unclear if you don't. (Or, it goes without saying, skip it.)
Start with an example. Let's say I'm interested in social theory. I can take two words—"social" and "political"—and count how frequent each of them is --something like two or three out of every thousand words is one of those. I can even make a chart, where every point is a book, with one axis the percentage of words in that book that are "social" and the other the percentage that are "political." I put a few books on it just to show what it finds:
I wrote yesterday about how well the filters applied to remove some books from ngrams work for increasing the quality of year information and OCR compared to Google books.
But we have no idea what books are in there. There's no connection to the texts from the data.
I'm particularly interested in how they deal with subsequent editions of books. Their methodology (pdf) talks about multiple editions of Tom Sawyer. I think it says that they eliminate multiple copies of the same edition but keep different years.
I thought I'd check this. There are about 5 occasions in Tom Sawyer where the phrase "Huck said" appears with separating quotes, and 11 for "said Huck." Both are phrases that basically appear only in Tom Sawyer in the 19th century (the latter also has a tiny life in legal contracts involving huckaback, and a few other places), so we can use it as a fair proxy for different editions. The first edition of Tom Sawyer was 1881: there are loads of later ones, obviously. Here's what you get from ngrams:
Three big spikes around 1900, and nothing before. Until about 1940, the ratio is somewhat consistent with the internal usage in the book, 11 to 5, although "said huck" is a little overrepresented as we might think. Note:
As I said: ngrams represents the state of the art for digital humanities right now in some ways. Put together some smart Harvard postdocs, a few eminent professors, the Google Books team, some undergrad research assistants for programming, then give them access to Google computing power and proprietary information to produce the datasets, and you're pretty much guaranteed an explosion of theories and methods.
Some of the theories are deeply interesting. I really like the censorship stuff. That really does deal with books specifically, not 'culture,' so it makes a lot of sense to do with this dataset. The stuff about half-lives for celebrity fame and particularly for years is cool, although without strict genre controls and a little more context I'm not sure what it actually says--it might be something as elegaic as the article's "We are forgetting our past faster with each passing year," but there are certainly more prosaic explanations. (Say: 1) footnotes are getting more and more common, and 2) footnotes generally cite more recent years than does main text. I think that might cover all the bases, too.) Yes, the big ideas, at least the ones I feel qualified to assess, are a little fuzzier—it's hard to tell what to do with the concluding description of wordcounts as "a great cache of bones from which to reconstruct the skeleton of a new science," aside from marveling at the BrooksianFreedmanian tangle of metaphor. (Sciences once roamed the earth?) But although a lot of the language of a new world order (have you seen the "days since first light" counter on their web page?) will rankle humanists, that fuzziness about the goals is probably good. This isn't quite sociobiology redux, intent on forcing a particular understanding of humanity on the humanities. It's just a collection of data and tools that they find interesting uses for, and we can too.
But it's the methods that should be more exciting for people following this. Google remains ahead of the curve in terms of both metadata and OCR, which are the stuff of which digital humanities is made. What does the Science team get?
(First in a series on yesterday's Google/Harvard paper in Scienceand its reception.)
So there are four things I'm immediately interested from yesterday's Google/Harvard paper.
A team of linguists, computer scientists and other non-humanists published that paper in Science about using Google data for word counts to outline the new science of 'culturomics';
They described the methodology they used to get word counts out of the raw metadata and scans, which presumably represents the best Google could do in 2008-09;
Google released a web site letting you chart the shifts in words and phrases over time;
Google released the core data powering that site containing data on word, book, and page occurrences for various combinations of words.
Twitter seems largely focused on #3 as a fascinating tool/diversion, the researchers seem to hope that #1 will create a burst of serious research using #4, and anyone doing research in the field should be eagerly scanning #2 for clues about what the state of art is—how far you can get with full cooperation from Google, with money to hire programmers, etc, and with unlimited computing infrastructure.
Each of these is worth thinking about in turn. Cut through all of it, though, and I think the core takeaway should be this:
Humanists need to be more involved in how these massive stores of data are used.
Days from when I said"Google Trends for historical terms might be worse than nothing" to the release of "Google ngrams:" 12. So: we'll get to see!
Also, I take back everything I said about 'digital humanities' having unfortunate implications. "Culturomics"—like 'culturenomics', but fluffier?—takes the cake.
Anyway, I should have some more thoughts on this later. I have them now, I suppose, but let me digest. For now, just dwell on the total lack of any humanists in that article promising to revolutionize the humanities.
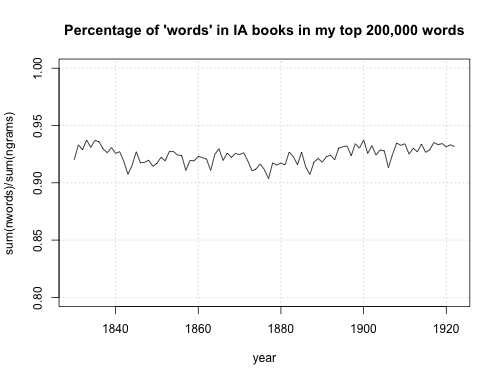
We all know that the OCR on our digital resources is pretty bad. I've often wondered if part of the reason Google doesn't share its OCR is simply it would show so much ugliness. (A common misreading, 'tlie' for 'the', gets about 4.6m results in Google books). So how bad is the the internet archive OCR, which I'm using? I've started rebuilding my database, and I put in a few checks to get a better idea. Allen already asked some questions in the comments about this, so I thought I'd dump it on to the internet, since there doesn't seem to be that much out there.
First: here's a chart of the percentage of "words" that lie outside my list of the top 200,000 or so words. (See an earlier post for the method). The recognized words hover at about 91-93 percent for the period. (That it's lowest in the middle is pretty good evidence the gap isn't a product of words entering or leaving the language).
Now, that has flaws in both directions. Here are some considerations that would tend to push the OCR error rate on a word basis lower than 8%:
Can historical events suppress use of words? Usage of the word 'panic' seems to spike down around the bank panics of 1873 and 1893, and maybe 1837 too. I'm pretty confident this is just an artifact of me plugging in a lot of words in to test out how fast the new database is and finding some random noise. There are too many reasons to list: 1857 and 1907 don't have the pattern, the rebound in 1894 is too fast, etc. It's only 1873 that really looks abnormal. What do you think:
But it would be really interesting if true--in my database of mostly non-newsy texts, do authors maybe shy away from using words that have too specific a meaning at the present moment? Lack of use might be interesting in all sorts of other ways, even if this one is probably just a random artifact.
I'm interested in the ways different words are tied together. That's sort of the universal feature of this project, so figuring out ways to find them would be useful. I already looked at some ways of finding interesting words for "scientific method," but that was in the context of the related words as an endpoint of the analysis. I want to be able to automatically generate linked words, as well. I'm going to think through this staying on "capitalist" as the word of the day. Fair warning: this post is a rambler.
Earlier I looked at some sentences to conclude that language about capitalism has always had critics in the American press (more, Dan said in the comments, than some of the historiography might suggest). Can we find this by looking at numbers, rather than just random samples of text? Let's start with a log-scale chart about what words get used in the same sentence as "capitalist" or "capitalists" between 1918 and 1922. (I'm going to just say capitalist, but my numbers include the plural too).
A commenter asked about why I don't improve the metadata instead of doing this clustering stuff, which seems just poorly to reproduce the work of generations of librarians in classifying books. I'd like to. The biggest problem right now for text analysis for historical purposes is metadata (followed closely by OCR quality). What are the sources? I'm going to think through what I know, but I'd love any advice on this because it's really outside my expertise.
For reasons related to my metadata, I had my computer assemble some data on the frequencies of the most common words (I explain why at the end of the post.) But it raises some exciting possibilities using forms of clustering and principal components analysis (PCA); I can't resist speculating a little bit about what else it can do to help explore ways different languages intersect. With some charts at the bottom.
Maybe this is just Patricia Cohen's take, but it's interesting to note that she casts both of the text mining projects she's put on the Times site this week (Victorian books and the Stanford Literature Lab) as attempts to use modern tools to address questions similar to vast, comprehensive tomes written in the 1950s. There are good reasons for this. Those books are some of the classics that informed the next generation of scholarship in their field; they offer an appealing opportunity to find people who should have read more than they did; and, more than some recent scholarship, they contribute immediately to questions that are of interest outside narrow disciplinary communities. (I think I've seen the phrase 'public intellectuals' more times in the four days I've been on Twitter than in the month before). One of the things that the Times articles highlight is how this work can re-engage a lot of the general public with current humanities scholarship.
But some part of my ABD self is a little uncomfortable with reaching so far back. As important as it is to get the general public on board with digital humanities, we also need to persuade less tech-interested, but theory-savvy, scholars that this can create cutting edge research, not just technology. The lede for P. Cohen's first article—that the Theory Wars can be replaced by technology—isn't going to convince many inside the academy. Everybody's got a theory. It's better if you can say what it is.
Dan asks for some numbers on "capitalism" and "capitalist" similar to the ones on "Darwinism" and "Darwinist" I ran for Hank earlier. That seems like a nice big question I can use to get some basic methods to warm up the new database I set up this week and to get some basic functionality written into it.
I'm going to go step-by-step here at some length to show just how cyclical a process this is--the computer is bad at semantic analysis, and it requires some actual knowledge of the history involved to get anything very useful out of the raw data on counts. A lot of comments on semantic analysis make it sound like it's asking computers to think for us, so I think it's worth showing that most of the R functions I'm using generally operate at a pretty low level--doing some counting, some index work, but nothing too mysterious.
This verges on unreflective datadumping: but because it's easy and I think people might find it interesting, I'm going to drop in some of my own charts for total word use in 30,000 books by the largest American publishers on the same terms for which the Times published Cohen's charts of title word counts. I've tossed in a couple extra words where it seems interesting—including some alternate word-forms that tell a story, using a perl word-stemming algorithm I set up the other day that works fairly well. My charts run from 1830 (there just aren't many American books from before, and even the data from the 30s is a little screwy) to 1922 (the date that digital history ends--thank you, Sonny Bono.) In some cases, (that 1874 peak for science), the American and British trends are surprisingly close. Sometimes, they aren't.
This is pretty close to Cohen's chart, and I don't have much to add. In looking at various words that end in -ism, I got some sense earlier of how individual religious discussions--probably largely in history—peak at substantially different times. But I don't quite have the expertise in American religious history to fully interpret that data, so I won't try to plug any of it in.
Patricia Cohen's new article about the digital humanities doesn't come with the rafts of crotchety comments the first one did, so unlike last time I'm not in a defensivecrouch. To the contrary: I'm thrilled and grateful that Dan Cohen, the main subject of the article, took the time in his moment in the sun to link to me. The article itself is really good, not just because the Cohen-Gibbs Victorian project is so exciting, but because P. Cohen gets some thoughtful comments and the NYT graphic designers, as always, do a great job. So I just want to focus on the Google connection for now, and then I'll post my versions of the charts the Times published.
Lexical analysis widens the hermeneutic circle. The statistics need to be kept close to the text to keep any work sufficiently under the researcher's control. I've noticed that when I ask the computer to do too much work for me in identifying patterns, outliers, and so on, it frequently responds with mistakes in the data set, not with real historical data. So as I start to harness this new database, one of the big questions is how to integrate what the researcher already knows into the patterns he or she is analyzing.
This is all by way of showing off the latest thing it lets me do--get examples of actual usage so we can do semantic processing ourselves, rather than trying to have a computer do it poorly. It might be good to put some tests like this into the code by default, as a check on interpretive hubris. I need to put the years and titles in here too, but if we just take a random set of samples of the language of natural selection, I think it's already clear that we get an interesting new form of text to interpret; it's sort of like reading the usage examples in the OED, except that we can create much more interesting search contraints on where our passages come from.
> get.usage.example("natural selection",sample(books,1)) [1] "we might extend the parallel and get some good illustrations of natural selection from the history of architecture and the origin of the different styles under different climates and conditions"
I have my database finally running in a way that lets me quickly select data about books. So now I can start to ask questions that are more interesting than just how overall vocabulary shifted in American publishers. The question is, what sort of questions? I'll probably start to shift to some of my dissertation stuff, about shifts in verbs modifying "attention", but there are all sorts of things we can do now. I'm open to suggestions, but here are some random examples:
1. How does the vocabulary used around slavery change between the 1850s and the 1890s, or the 1890s and the 1920s? Probably the discursive space widens--but in what kind of ways, and what sorts of authors use rhetoric of slavery most freely?
2. How do various social and political words cluster by book in the progressive era? Maybe these are words that appear disproportionately often in a sentence with "reform." Can we identify the closeness of ties between various social movements (suffragism, temperance, segregation, municipal government) based on some sort of clustering of co-mentions in books, as I did for the isms?
Questions don't have to be historical, either: they can plug in to other American Studies areas:
3. What different sorts of words are used to modify 'city' or 'crowd' in the novels of (say) Howells, James, and Dreiser? How does it change over time within some of them?
4. What sorts of books discuss the plays of Shakespeare between 1850 and 1922--can we identify a shift in a) the sorts of books writing about him that could confirm some Highbrow/Lowbrow stuff, or b) the particular plays that get mention or praise?
So I just looked at patterns of commemoration for a few famous anniversaries. This is, for some people, kind of interesting--how does the publishing industry focus in on certain figures to create news or resurgences of interest in them? I love the way we get excited about the civil war sesquicentennial now, or the Darwin/Lincoln year last year.
I was asking if this spike in mentions of Thoreau in 1917, is extraordinary or merely high.
Emerson (1903) doesn't seem to have much a spike--he's up in 1904 with everyone, although Hawthorne, whose centenary is 1904, isn't up very much.
Can we look at the centennial spikes for a lot of authors? Yes. The best way would be to use a biographical dictionary or wikipedia or something, but I can also just use the years built into some of my author metadata to get a rough list of authors born between 1730 and 1822, so they can have a centenary during my sample. A little grepping gets us down to thousand or so authors. Here are the ten with the most books, to check for reliability:
I was starting to write about the implicit model of historical change behind loess curves, which I'll probably post soon, when I started to think some more about a great counterexample to the gradual change I'm looking for: the patterns of commemoration for anniversaries. At anniversaries, as well as news events, I often see big spikes in wordcounts for an event or person.
I've always been interested in tracking changes in historical memory, and this is a good place to do it. I talked about the Gettysburg sesquicentennial earlier, and I think all the stuff about the civil war sesquicentennial (a word that doesn't show up in my top 200,000, by the way) prompted me to wonder whether the commemorations a hundred years ago helped push forward practices in the publishing industry of more actively reflecting on anniversaries. Are there patterns in the celebration of anniveraries? For once my graphs will be looking at the spikes, not the general trends. With two exceptions to start: the words themselves:
So that's a start: the word centennial was hardly an American word at all before 1876, and it didn't peak until 1879. The Loess trend puts the peak around 1887. So it seems like not only did the American centennial put the word into circulation, it either remained a topic of discussion or spurred a continuing interest in centennials of Founding era events for over a decade.
Jamie's been asking for some thoughts on what it takes to do this--statistics backgrounds, etc. I should say that I'm doing this, for the most part, the hard way, because 1) My database is too large to start out using most tools I know of, including I think the R text-mining package, and 2) I want to understand how it works better. I don't think I'm going to do the software review thing here, but there are what look like a lot of promising leads at an American Studies blog.
It's easy to follow a few of these links and quickly end up drinking from a firehose of information. I get two initial impressions: 1) English is ahead of history on this; 2) there are a lot of highly developed applications for doing similar things with text analysis. The advantage is that it's leading me to think more carefully about how my applications are different than other people's.
I've had "digital humanities" in the blog's subtitle for a while, but it's a terribly offputting term. I guess it's supposed to evoke future frontiers and universal dissemination of humanistic work, but it carries an unfortunate implication that the analog humanities are something completely different. It makes them sound older, richer, more subtle—and scheduled for demolition. No wonder a world of online exhibitions and digital texts doesn't appeal to most humanists of the tweed– and dust-jacket crowd. I think we need a distinction that better expresses how digital technology expands the humanities, rather than constraining it.
It's too easy to think Digital Humanities is about teaching people to think like computers, when it really should be about making computers think like humanists.* What we want isn't digital humanities; it's humanities computing. To some degree, we all know this is possible—we all think word processors are better than pen and paper, or jstor better than buried stacks of journals (musty musings about serendipity aside). But we can go farther than that. Manfred Kuehn's blog is an interesting project in exploring how notetaking software can reflect and organize our thinking in ways that create serendipity within one person's own notes. I'm trying to figure out ways of doing that on a larger body of texts, but we could think of those as notes, themselves.
Jamie asked about assignments for students using digital sources. It's a difficult question.
A couple weeks ago someone referred an undergraduate to me who was interested in using some sort of digital maps for a project on a Cuban emigre writer like the ones I did of Los Angeles German emigres a few years ago. Like most history undergraduates, she didn't have any programming background, and she didn't have a really substantial pile of data to work with from the start. For her to do digital history, she'd have to type hundreds of addresses and dates off of letters from the archives, and then learn some sort of GIS software or google maps API, without any clear payoff. No would get much out of forcing her to spend three days playing with databases when she's really looking at the contents of letters.
I think genre data would be helpful in all sorts of ways--tracking evolutionary language through different sciences, say, or finding what discourses are the earliest to use certain constructions like "focus attention." The Internet Archive books have no genre information in their metadata, for the most part. The genre data I think I want to use would Library of Congress call numbers--that divides up books in all sorts of ways at various levels that I could parse. It's tricky to get from one to the other, though. I could try to hit the LOC catalog with a script that searches for title, author and year from the metadata I do have, but that would miss a lot and maybe have false positives, plus the LOC catalog is sort of tough to machine-query. Or I could try to run a completely statistical clustering, but I don't trust that that would come out with categories that correspond to ones in common use. Some sort of hybrid method might be best--just a quick sketch below.
Most intensive text analysis is done on heavily maintained sources. I'm using a mess, by contrast, but a much larger one. Partly, I'm doing this tendentiously--I think it's important to realize that we can accept all the errors due to poor optical character recognition, occasional duplicate copies of works, and so on, and still get workable materials.
Using worse sources is something of a necessity for digital history. The text recognition and the metadata for a lot of the sources we use often—google books, jstor, proquest—is full of errors under the surface, and it's OK for us to work with such data in the open. The historical profession doesn't have any small-ish corpuses we would be interested in analyzing again and again. This isn't true of English departments, who seem to be well ahead of historians in computer-assisted text analysis, and have the luxury of emerging curated text sources like the one Martin Mueller describes here.
But the side effect of that is that we need to be careful about understanding what we're working with. So I'm running periodic checks on the data in my corpus of books by major American publishers (described more earlier) to see what's in there. I thought I'd post the list of the top twenty authors, because I found it surprising, though not in a bad way. We'll do from no. 20 ranking on up, because that's how they do it on sports blogs. (What I really should do is a slideshow to increase pageviews). I'll identify the less famous names.
In addition to finding the similarities in use between particular isms, we can look at their similarities in general. Since we have the distances, it's possible to create a dendrogram, which is a sort of family tree. Looking around the literary studies text-analysis blogs, I see these done quite a few times to classify works by their vocabulary. I haven't seen much using words, though: but it works fairly well. I thought it might help answer Hank's question about the difference between evolutionism and darwinism, but, as you'll see, that distinction seems to be a little too fine for now.
Here's the overall tree of the 400-ish isms, with the words removed, just to give a sense. We can cut the tree at any point to divide into however many groups we'd like. The top three branches essentially correspond to 1) Christian and philosophical terminology, 2) social, historical, and everything else, and 3) medical and some scientific terminology.
What can we do with this information we’ve gathered about unexpected occurrences? The most obvious thing is simply to look at what words appear most often with other ones. We can do this for any ism given the data I’ve gathered. Hank asked earlier in the comments about the difference between "Darwinism" and evolutionism, so:
Phenomenism appears 2,595%—26 times—more often in books about Darwin than chance would imply. That revolutionism is so high is certainly interesting, and maybe there’s some story out there about why hermaphroditism is so high. The takeaway might be that Darwinism appears as much in philosophical literature as scientific, which isn’t surprising.
But we don’t just have individual counts for words—we have a network of interrelated meanings that lets us compare the relations across all the interrelations among words. We can use that to create a somewhat different list of words related to Darwinism:
Now to the final term in my sentence from earlier—“How often, compared to what we would expect, does a given word appear with any other given word?”. Let’s think about How much more often. I though this was more complicated than it is for a while, so this post will be short and not very important.
Basically, I’m just using the percentage of time more often as the measuring stick—I fiddled around with standard deviations for a while, but I don’t have a good way to impute expected variations, and percentages seems to work well enough. I do want to talk for a minute about an aspect that I’ve glossed over so far—how do we measure the occurrences of a word relative to itself?
Abraham Lincoln invented Thanksgiving. And I suppose this might be a good way to prove to more literal-minded students that the Victorian invention of tradition really happened. Other than that, I don't know what this means.
This is the second post on ways to measure connections—or more precisely, distance—between words by looking at how often they appear together in books. These are a little dry, and the payoff doesn't come for a while, so let me remind you of the payoff (after which you can bail on this post). I’m trying to create some simple methods that will work well with historical texts to see relations between words—what words are used in similar semantic contexts, what groups of words tend to appear together. First I’ll apply them to the isms, and then we’ll put them in the toolbox to use for later analysis. I said earlier I would break up the sentence “How often, compared to what we would expect, does a given word appear with any other given word?” into different components. Now let’s look at the central, and maybe most important, part of the question—how often do we expect words to appear together?
I’m back from Moscow, and with a lot of blog content from my 23-hour itinerary. I’m going to try to dole it out slowly, though, because a lot of it is dull and somewhat technical, and I think it’s best to intermix with other types of content. I think there are four things I can do here.
1.Document my process of building up a specific system and set of techniques for analyzing texts from the internet archive, and publishing an account my tentative explorations into the structure of my system.
2.Trying to produce some chunks of writing that I could integrate into presentations (we’re talking about one in Princeton in February) and other non-blog writing.
3.Digging in with the data into some major questions in American intellectual history to see whether we can get anything useful out of it.
4.Reflecting on the state of textual analysis within the digital humanities, talking about how it can be done outside of my Perl-SQL-R framework, and thinking about how to overcome some of the more gratuitous obstacles in its way.
I’m interested in all of these, but find myself most naturally writing the first two (aside from a few manifestos of type 4 written in a haze of Russia and midnight flights that will likely never see the light of day). I think my two commenters may like the latter two more.
So I think I’ll try to intersperse the large amount of type 1 that I have now with some other sorts of analysis over the next week or so. That includes a remake of the isms chart, a further look at loess curves, etc.
Ties between words are one of the most important things computers can tell us about language. I already looked at one way of looking at connections between words in talking about the phrase "scientific method"--the percentage of occurrences of a word that occur with another phrase. I've been trying a different tack, however, in looking at the interrelations among the isms. The whole thing has been do complicated--I never posted anything from Russia because I couldn't get the whole system in order in my time here. So instead, I want to take a couple posts to break down a simple sentence and think about how we could statistically measure each component. Here's the sentence:
How often, compared to what we would expect, does a given word appear with any other given word?
In doing the math, we have to work from the back to the front, so this post is about the last part of the sentence: What does it mean to appear with another word?
One more note on that Grafton quote, which I'll post below.
“The digital humanities do fantastic things,” said the eminent Princeton historian Anthony Grafton. “I’m a believer in quantification. But I don’t believe quantification can do everything. So much of humanistic scholarship is about interpretation.”
“It’s easy to forget the digital media are means and not ends,” he added.
Anne pointed out at dinner that the reason this is so frustrating is because it gives far too much credit to quantification. Grafton has tossed out all the history of science he's been so involved in and pretends he thinks that the quantitative sciences use numbers to reveal irrefutable facts about the world. I'm sure there are people who do believe that they unearth truth through elaborate cliometrics; but those oddballs are far less harmful and numerous than those who think the humanities are about 'interpretations', and the sciences about 'facts.' Again, I bet this in some way this is a misstatement or misquotation. Still, it made it through because it's so representative of how a lot of the profession thinks.
I'm in Moscow now. I still have a few things to post from my layover, but there will be considerably lower volume through Thanksgiving.
I don't want to comment too much on yesterday (today's? I can't tell anymore) article about digital humanities in the New York Times, but a couple e-mail people e-mailed about it. So a couple random points:
1. Tony Grafton is, as always, magnanimous: but he makes an unfortunate distinction between "data" and "interpretation" that gives others cover to view digital humanities less charitably than he does. I shouldn't need to say this, but: the whole point of data is that it gives us new objects of interpretation. And the Grafton school of close reading, which seems to generally now involve writing a full dissertation on a single book, is also not a substitute for the full range of interpretive techniques that play on humanistic knowledge.
(more after the break)
What are the most distinctive words in the nineteenth century? That's an impossible question, of course. But as I started to say in my first post about bookcounts, [link] we can find something useful--the words that are most concentrated in specific texts. Some words appear at about the same rate in all books, while some are more highly concentrated in particular books. And historically, the words that are more highly concentrated may be more specific in their meanings--at the very least, they might help us to analyze genre or other forms of contextual distribution.
Because of computing power limitations, I can't use all of my 200,000 words to analyze genre--I need to pick a subset that will do most of the heavy lifting. I'm doing this by finding outliers on the curve of words against books. First, I'll show you that curve again. This time, I've made both axes logarithmic, which makes it easier to fit a curve. And the box shows the subset I'm going to zoom in on for classification--dropping a) the hundred most common words, and b) any words that appear in less than 5% of all books. The first are too common to be of great use (and confuse my curve fitting), and the second are so rare I'd need too many of them to make for useful categorization.
Hank asked for a couple of charts in the comments, so I thought I'd oblige. Since I'm starting to feel they're better at tracking the permeation of concepts, we'll use appearances per 1000 books as the y axis:
I'm going to keep looking at the list of isms, because a) they're fun; and b) the methods we use on them can be used on any group of words--for example, ones that we find are highly tied to evolution. So, let's use them as a test case for one of the questions I started out with: how can we find similarities in the historical patterns of emergence and submergence of words?
Well, let's take a few things for granted. First, we're interested in relative trends: we want to compare all words, say, that get twice as popular during World War I, regardless of how popular they were before. It's easy to normalize for that, but we're still left with a mess of different curves. Below the jump is a very ugly chart, with the adjusted loess curves for the 300 most popular isms, with "1" being a year in which a word is used its average amount.
Here's a fun way of using this dataset to convey a lot of historical information. I took all the 414 words that end in ism in my database, and plotted them by the year in which they peaked,* with the size proportional to their use at peak. I'm going to think about how to make it flashier, but it's pretty interesting as it is. Sample below, and full chart after the break.
It's time for another bookkeeping post. Read below if you want to know about changes I'm making and contemplating to software and data structures, which I ought to put in public somewhere. Henry posted questions in the comments earlier about whether we use Princeton's supercomputer time, and why I didn't just create a text scatter chart for evolution like the one I made for scientific method. This answers those questions. It also explains why I continue to drag my feet on letting us segment counts by some sort of genre, which would be very useful.
Henry asks in the comments whether the decline in evolutionary thought in the 1890s is the "'Eclipse of Darwinism,' rise or prominence of neo-Lamarckians and saltationism and kooky discussions of hereditary mechanisms?" Let's take a look, with our new and improved data (and better charts, too, compared to earlier in the week--any suggestions on design?). First,three words very closely tied to the theory of natural selection.
Three rises from around 1859, Origin's publication date (obviously the numbers for Spencer are inflated by other Spencers in the world, but the trend seems like it might be driven by Herbert); and three peaks at different points from 1885 to 1900, followed by a fall and perhaps a recovery. The question is: how significant are those falls, and how can we interpret them? First, let's look at the bookcounts: are those falls a result of less intensive discussion of the subjects, or of a waning in interest across all books?
All right, let's put this machine into action. A lot of digital humanities is about visualization, which has its place in teaching, which Jamie asked for more about. Before I do that, though, I want to show some more about how this can be a research tool. Henry asked about the history of the term 'scientific method.' I assume he was asking a chart showing its usage over time, but I already have, with the data in hand, a lot of other interesting displays that we can use. This post is a sort of catalog of what some of the low-hanging fruit in text analysis are.
The basic theory I'm working on here is that textual analysis isn't necessarily about answering research questions. (It's not always so good at doing that.) It can also help us channel our thinking into different directions. That's why I like to use charts and random samples rather than lists--they can help us come up with unexpected ideas, and help us make associations that wouldn't come naturally. Essentially, it's a different form of reading--just like we can get different sorts of ideas from looking at visual evidence vs. textual evidence, so can we get yet other ideas by reading quantitative evidence. The last chart in the post is good for that, I think. But first things first: the total occurrences of "scientific method" per thousand words.
This is what we've already had. But now I've finally got those bookcounts running too. Here is the number of books per thousand* that contain the phrase "scientific method":
I now have counts for the number of books a word appears in, as well as the number of times it appeared. Just as I hoped, it gives a new perspective on a lot of the questions we looked at already. That telephone-telegraph-railroad chart, in particular, has a lot of interesting differences. But before I get into that, probably later today, I want to step back and think about what we can learn from the contrast between between wordcounts and bookcounts. (I'm just going to call them bookcounts--I hope that's a clear enough phrase).
Roughly, wordcounts are how many times a word is said in my library, and bookcounts is how many different authors are saying it--or how many different readers are reading it. (Given prolific authors, multiple authors, etc. that's not quite true, but it's still an OK way to think about it). Since this is a quantitative blog, let's start with a chart. Here are the two different counts simply plotted against each other (please someone e-mail me if these image files don't come through as well as the earlier ones):
Each of the 200,000 points is a word--from "the," all the way up in the upper right hand corner, to a whole morass of words we've all forgotten and typos, down in the lower left. The red line is the theoretical minimum-- a word appearing in exactly as many books as is its word count.* This is abstract, I know, so let's add some of the words we've already been analyzing to the chart to humanize it a little. (By the time we get through with this, my little linguistic studies the last few entries will have taken us back to history, I promise).
Obviously, I like charts. But I've periodically been presenting data as a number of random samples, as well. It's a technique that can be important for digital humanities analysis. And it's one that can draw more on the skills in humanistic training, so might help make this sort of work more appealing. In the sciences, an individual data point often has very little meaning on its own--it's just a set of coordinates. Even in the big education datasets I used to work with, the core facts that I was aggregating up from were generally very dull--one university awarded three degrees in criminal science in 1984, one faculty member earned $55,000 a year. But with language, there's real meaning embodied in every point, that we're far better equipped to understand than the computer. The main point of text processing is to act as a sort of extraordinarily stupid and extraordinarily perseverant research assistant, who can bring patterns to our attention but is terrible at telling which patterns are really important. We can't read everything ourselves, but it's good to check up periodically--that's why I do things like see what sort of words are the 300,000th in the language, or what 20 random book titles from the sample are.
So any good text processing application will let us delve into the individual data as well as giving the individual picture. I'm circling around something commenter "Jamie" said, though not addressing it directly: (quote after break)
Here's what googling that question will tell you: about 400,000 words in the big dictionaries (OED, Webster's); but including technical vocabulary, a million, give or take a few hundred thousand. But for my poor computer, that's too many, for reasons too technical to go into here. Suffice it to say that I'm asking this question for mundane reasons, but the answer is kind of interesting anyway. No real historical questions in this post, though--I'll put the only big thought I have about it in another post later tonight.
I can't resist making a few more comments on that technologies graph that I laid out. I'm going to add a few thousand more books to the counts overnight, so I won't make any new charts until tomorrow, but look at this one again.
You remember I claimed that some intellectual movements spread like technologies, and some like news. But that's only looking at the smoothed curves. As you've probably figured out, I plot two sets of data for each word--a thin solid line for the actual data, and a large dotted line for a smoothed version (for the record, a loess smoothing that looks at 15% of the total for each point). What do the peaks mean?
You mention in the post about evolution & efficiency that "Offhand, the evolution curve looks more the ones I see for technologies, while the efficiency curve resembles news events."
That's a very interesting observation, and possibly a very important one if it's original to you, and can be substantiated. Do you have an example of a tech vs news event graph? Something like lightbulbs or batteris vs the Spanish American war might provide a good test case.
Also, do you think there might be changes in how these graphs play out over a century? That is, do news events remain separate from tech stuff? Tech changes these days are often news events themselves, and distributed similarly across media.
I think another way to put the tech vs news event could be in terms of the kind of event it is: structural change vs superficial, mid-range event vs short-term.
Anyhow, a very interesting idea, of using the visual pattern to recognize and characterize a change. While I think your emphasis on the teaching angle (rather than research) is spot on, this could be one application of these techniques where it'd be more useful in research.
He or she is right that technology vs. news isn't quite the right way to describe it. Even in the 19C, some technology changes are news events, while others aren't. But let's look at some examples here.
I've rushed straight into applications here without taking much time to look at the data I'm working with. So let me take a minute to describe the set and how I'm trimming it.
A collection as large as the Internet Archive's OCR database means I have to think through what I want well in advance of doing it. I'm only using a small subset of their 900,000 Google-scanned books, but that's still 16 gigabytes--it takes a couple hours just to get my baseline count of the 200,000 most common words. I could probably improve a lot of my search time through some more sophisticated database management, but I'll still have to figure out what sort of relations are worth looking for. So what are some?
Let's start with just some of the basic wordcount results. Dan Cohen posted some similar things for the Victorian period on his blog, and used the numbers mostly to test hypotheses about change over time. I can give you a lot more like that (I confirmed for someone, though not as neatly as he'd probably like, that 'business' became a much more prevalent word through the 19C). But as Cohen implies, such charts can be cooler than they are illuminating.
But you can get into some interesting analysis even just at the wordcount level. Look at this chart (sorry if it's small):
The red line is the frequency of the word 'evolution'; the green one, 'efficiency.' (I'll put a post at some point on how to read these graphs better.) Each one of those terms gets a week in your typical intellectual history survey, and each one has a canonical author associated with it. (If you're a little fuzzy, Darwin's Origin of the Species is 1859; Taylor's Scientific Management is 1911, Shop Management 1903). And sure enough, both climb out of the ocean of insignificant words around the time we'd expect them to.
But look at the differences between the two. "Evolution" starts its climb shortly after Darwin publishes (the real spike in the data seems to be 1864, which gives Americans a chance to make it through that book), and rises in prominence for decades. "Efficiency," on the other hand, increases in prominence five times in the first fifteen years of the century, before leveling off a bit. Taylor's most famous work is at middle of the curve, and his first one is part of the rise, not before it. Both words show a major addition to shared cultural vocabulary, but the way they are taken in shows they are two very different intellectual movements.
I'm going to start using this blog to work through some issues in finding useful applications for digital history. (Interesting applications? Applications at all?)
Right now, that means trying to figure out how to use large amounts of textual data to draw conclusions or refine questions. I currently have the Internet Archive's OCRed text files for about 30,000 books by large American publishers from 1830 to 1920. I've done this partly to help with my own research, and partly to try a different way of thinking about history and the texts we read.
I'm putting it online to help convince one or two people (I'm looking at you, Henry) that this sort of exploration is important for research and teaching. Not necessarily that it's research itself; I'm still unimpressed by the conclusions I'm getting out of it. But at least that any historian looking at the meanings of words (which is most of us, at least around here) should make some stab at using the texts of books we haven't read. And if I can get some good graphics out of it, maybe we can start to think about how this might be useful in teaching, particularly students who respond better to data than stories.